
Bilkul. Is 9.22 ROAS PPC Case Study ke liye aap ek proper, detailed, professional case-study page bana sakte hain. Neeche ka content screenshot ke actual metrics par grounded hai; jahan screenshot exact strategy prove nahi karta, wahan main unsupported claims add nahi kar raha.
$39K+ Sales Generated at 9.22 ROAS and 10.85% ACOS
Overview
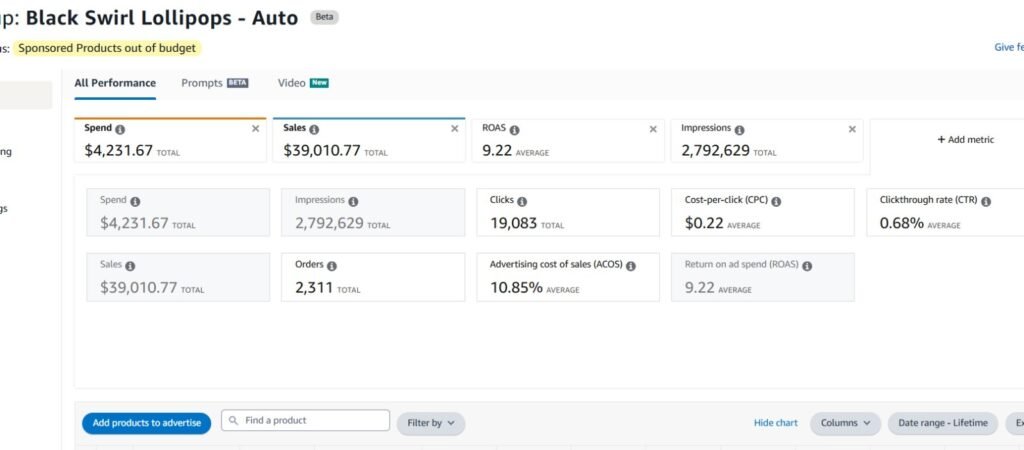
This case study presents the advertising performance of an Amazon Sponsored Products campaign that generated $39,010.77 in attributed sales from $4,231.67 in advertising spend.
During the reporting period shown in the dashboard, the campaign achieved an average Return on Ad Spend (ROAS) of 9.22 and an average Advertising Cost of Sales (ACOS) of 10.85%.
The campaign also generated substantial marketplace visibility, reaching more than 2.79 million impressions, producing 19,083 clicks, and contributing to 2,311 attributed orders.
The results demonstrate a strong relationship between advertising investment and revenue generated through paid Amazon traffic.
Key Performance Results
$39,010.77
Attributed Advertising Sales
The campaign generated more than $39K in sales attributed to Amazon advertising.
$4,231.67
Advertising Spend
Total advertising investment during the reporting period was approximately $4.23K.
9.22
Average ROAS
For every $1 spent on advertising, approximately $9.22 in attributed sales was generated.
10.85%
Average ACOS
Advertising spend represented approximately 10.85% of attributed advertising sales.
2,311
Attributed Orders
The advertising activity contributed to more than 2,300 customer orders.
2,792,629
Impressions
The campaigns generated approximately 2.79 million advertising impressions.
19,083
Clicks
More than 19,000 shoppers clicked on the ads.
$0.22
Average CPC
The average cost to generate one advertising click was $0.22.
0.68%
Average CTR
The overall click-through rate was 0.68%.
Campaign Performance
The advertising dashboard shows a strong overall level of efficiency.
With only $4,231.67 in spend, the campaign produced $39,010.77 in attributed sales.
This means that the advertising investment generated considerably more revenue than the amount spent on acquiring traffic.
The resulting 9.22 ROAS provides a straightforward measure of the campaign’s sales productivity.
In simple terms:
Every $1 of advertising spend generated approximately $9.22 in attributed sales.
At the same time, the campaign maintained an average ACOS of 10.85%, indicating that advertising costs accounted for a relatively small percentage of the revenue attributed to the campaign.
Advertising Efficiency
Advertising performance should not be assessed only by total sales.
Efficiency is equally important.
In this campaign, the relationship between spend and sales was:
Spend: $4,231.67
Sales: $39,010.77
Using these values:
ACOS = Advertising Spend ÷ Advertising Sales × 100
This produces approximately 10.85% ACOS, consistent with the Amazon dashboard.
The inverse relationship is represented through ROAS:
ROAS = Advertising Sales ÷ Advertising Spend
This produces approximately 9.22 ROAS.
Together, these metrics show that the campaign produced a strong level of attributed sales relative to advertising cost.
Marketplace Visibility
The campaigns accumulated approximately:
2,792,629 impressions
This represents the number of times the advertisements were displayed to shoppers.
High impression volume is particularly important on Amazon because it reflects the level of exposure being generated through paid placements.
However, impressions alone do not create value unless they lead to shopper engagement and ultimately purchases.
In this case, those impressions generated:
19,083 clicks
and eventually:
2,311 attributed orders
This allows the performance story to be viewed across the entire advertising funnel:
2.79M impressions → 19K clicks → 2,311 orders → $39K+ attributed sales
Click Performance
The campaign recorded an average:
CTR: 0.68%
CTR measures how many shoppers clicked the advertisements after seeing them.
The dashboard indicates that approximately 19,083 clicks were generated from 2.79 million impressions.
For a PPC portfolio, this metric helps evaluate whether ad placements are generating shopper interest.
CTR should normally be considered alongside other metrics such as:
- Cost per click
- Orders
- Conversion performance
- ACOS
- ROAS
because a high click rate by itself does not necessarily mean an advertising campaign is profitable.
In this case, the stronger evidence comes from the combination of substantial click volume with 2,311 orders and 9.22 ROAS.
Cost Per Click
The average cost per click was:
$0.22
This means the campaign generated more than 19,000 visits from paid advertising at an average acquisition cost of approximately twenty-two cents per click.
CPC is important because rising click costs can quickly reduce campaign profitability.
The relatively low CPC visible in this dashboard helped support the campaign’s overall advertising efficiency.
However, CPC should never be evaluated in isolation.
The more meaningful relationship is:
Cost per click → customer orders → attributed revenue
The dashboard indicates that the traffic produced by the campaign ultimately contributed to more than $39K in attributed advertising sales.
Order Generation
The campaign generated:
2,311 attributed orders
This is an important performance indicator because it demonstrates that the campaign did not simply produce visibility or clicks.
It generated actual purchasing activity.
The advertising funnel can therefore be summarized as:
2.79M+ Impressions
↓
19,083 Clicks
↓
2,311 Orders
↓
$39,010.77 Sales
This gives visitors to your portfolio a clearer understanding of the commercial scale of the advertising activity.
Revenue Performance
The campaign produced:
$39,010.77 in attributed sales
against:
$4,231.67 in advertising spend
This indicates a strong relationship between investment and revenue.
Rather than highlighting sales alone, this case study is stronger because the dashboard also provides the advertising cost required to generate those sales.
This makes the result more transparent.
The combination of:
- $39K+ sales
- $4.2K spend
- 9.22 ROAS
- 10.85% ACOS
provides a clearer picture of the campaign’s efficiency than simply presenting revenue on its own.
Performance Funnel
For your website, I recommend showing this section visually:
2.79M+
Impressions
↓
19,083
Clicks
↓
2,311
Orders
↓
$39,010.77
Attributed Sales
↓
9.22
ROAS
This creates a much stronger case-study presentation than one long paragraph.
What the Results Demonstrate
Based on the dashboard, this case study demonstrates performance across several important dimensions:
- Strong advertising reach
- Significant shopper traffic
- More than 2,300 attributed orders
- More than $39K in attributed revenue
- Controlled advertising cost relative to sales
- Strong return on advertising spend
- Low average CPC
- Scalable marketplace exposure
The strongest result is the combination of 9.22 ROAS and 10.85% ACOS rather than any single metric in isolation.
Commercial Interpretation
An Amazon advertiser can generate large sales numbers simply by spending aggressively.
For that reason, sales should always be viewed together with advertising cost.
Here, the dashboard provides both sides of the equation.
The campaign spent approximately $4.2K and generated approximately $39K in attributed advertising sales.
That translates into a substantial revenue multiple on advertising investment.
This makes the case study particularly useful for demonstrating PPC performance because it presents both scale and efficiency.
Results Summary
The advertising portfolio delivered:
$39,010.77 in attributed sales
from $4,231.67 in spend.
The campaign achieved:
- 9.22 ROAS
- 10.85% ACOS
- 2,311 orders
- 2.79M+ impressions
- 19,083 clicks
- $0.22 average CPC
- 0.68% CTR
These results indicate a campaign that produced substantial attributed revenue while maintaining relatively controlled advertising costs.
Conclusion
This case study highlights an Amazon Sponsored Products advertising portfolio that combined significant marketplace reach with strong revenue efficiency.
The campaign generated more than 2.79 million impressions, attracted over 19,000 clicks, and contributed to 2,311 attributed orders.
Most importantly, approximately $4,231 in advertising investment generated $39,010.77 in attributed sales, resulting in a 9.22 ROAS and 10.85% ACOS.
The performance demonstrates the commercial value of managing Amazon PPC based not only on sales volume, but also on the relationship between advertising investment, traffic, orders, and revenue.